pgMustard
This guide explains how to troubleshoot slow queries on Supabase using explain and pgMustard.
pgMustard is a visualization tool for explain analyze that also gives performance tips.
Step 1: Get the query plan from Supabase
Use explain analyze to get a query plan from Postgres. This will run the query behind the scenes, so be careful with data modification queries.
pgMustard requires plans to be in json format, and the buffers, verbose, and settings parameters allow it to give better tips.
So a good prefix for your query would be:
explain (analyze, format json, buffers, verbose, settings)
Run the query, and copy the output.
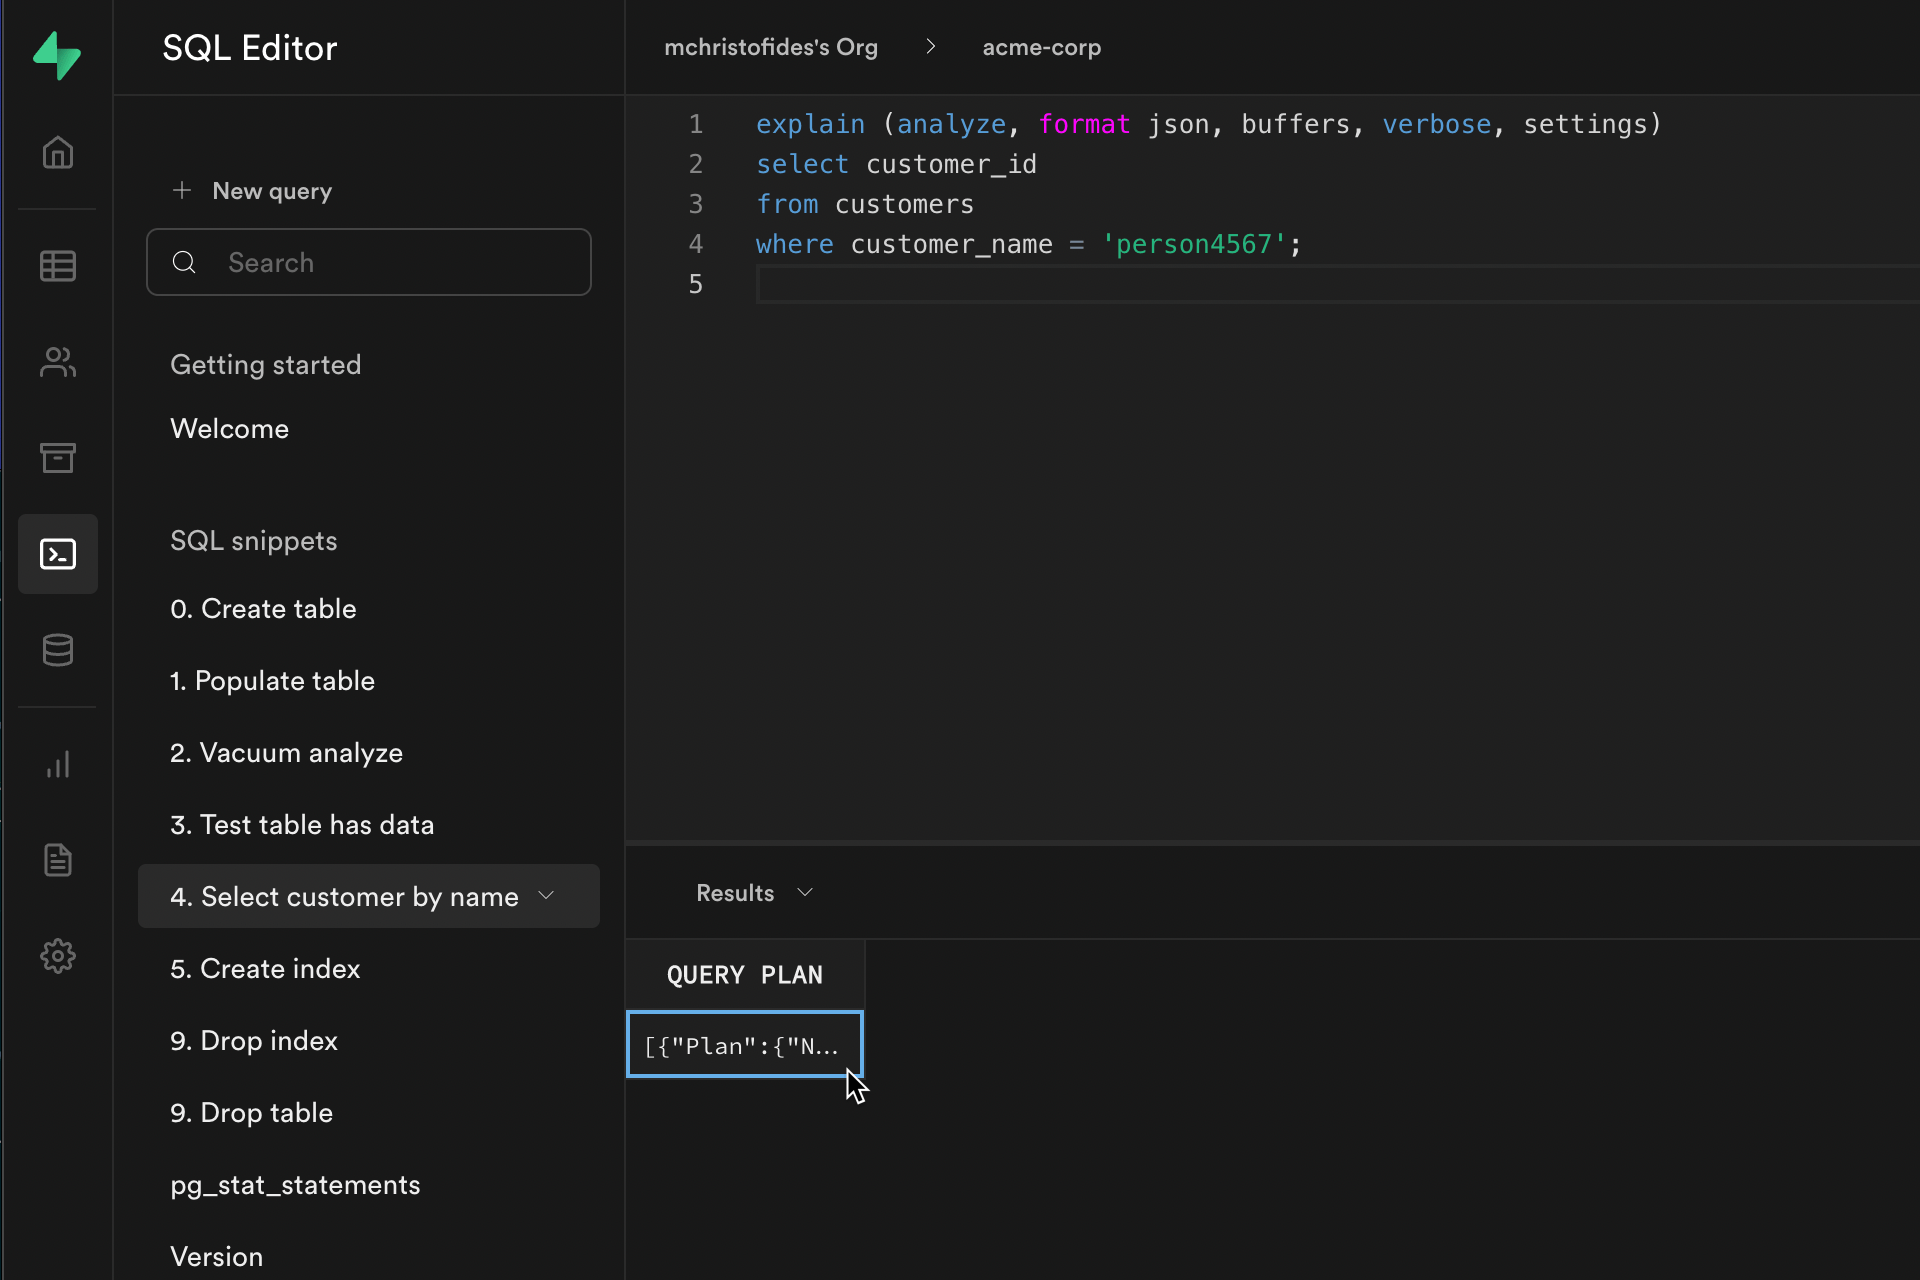
If you’re using the Supabase SQL Editor, this is easily copied from the cell titled QUERY PLAN, as seen above.
If you have any trouble, check out pgMustard’s guide for getting a query plan.
Step 2: Paste the query plan into pgMustard
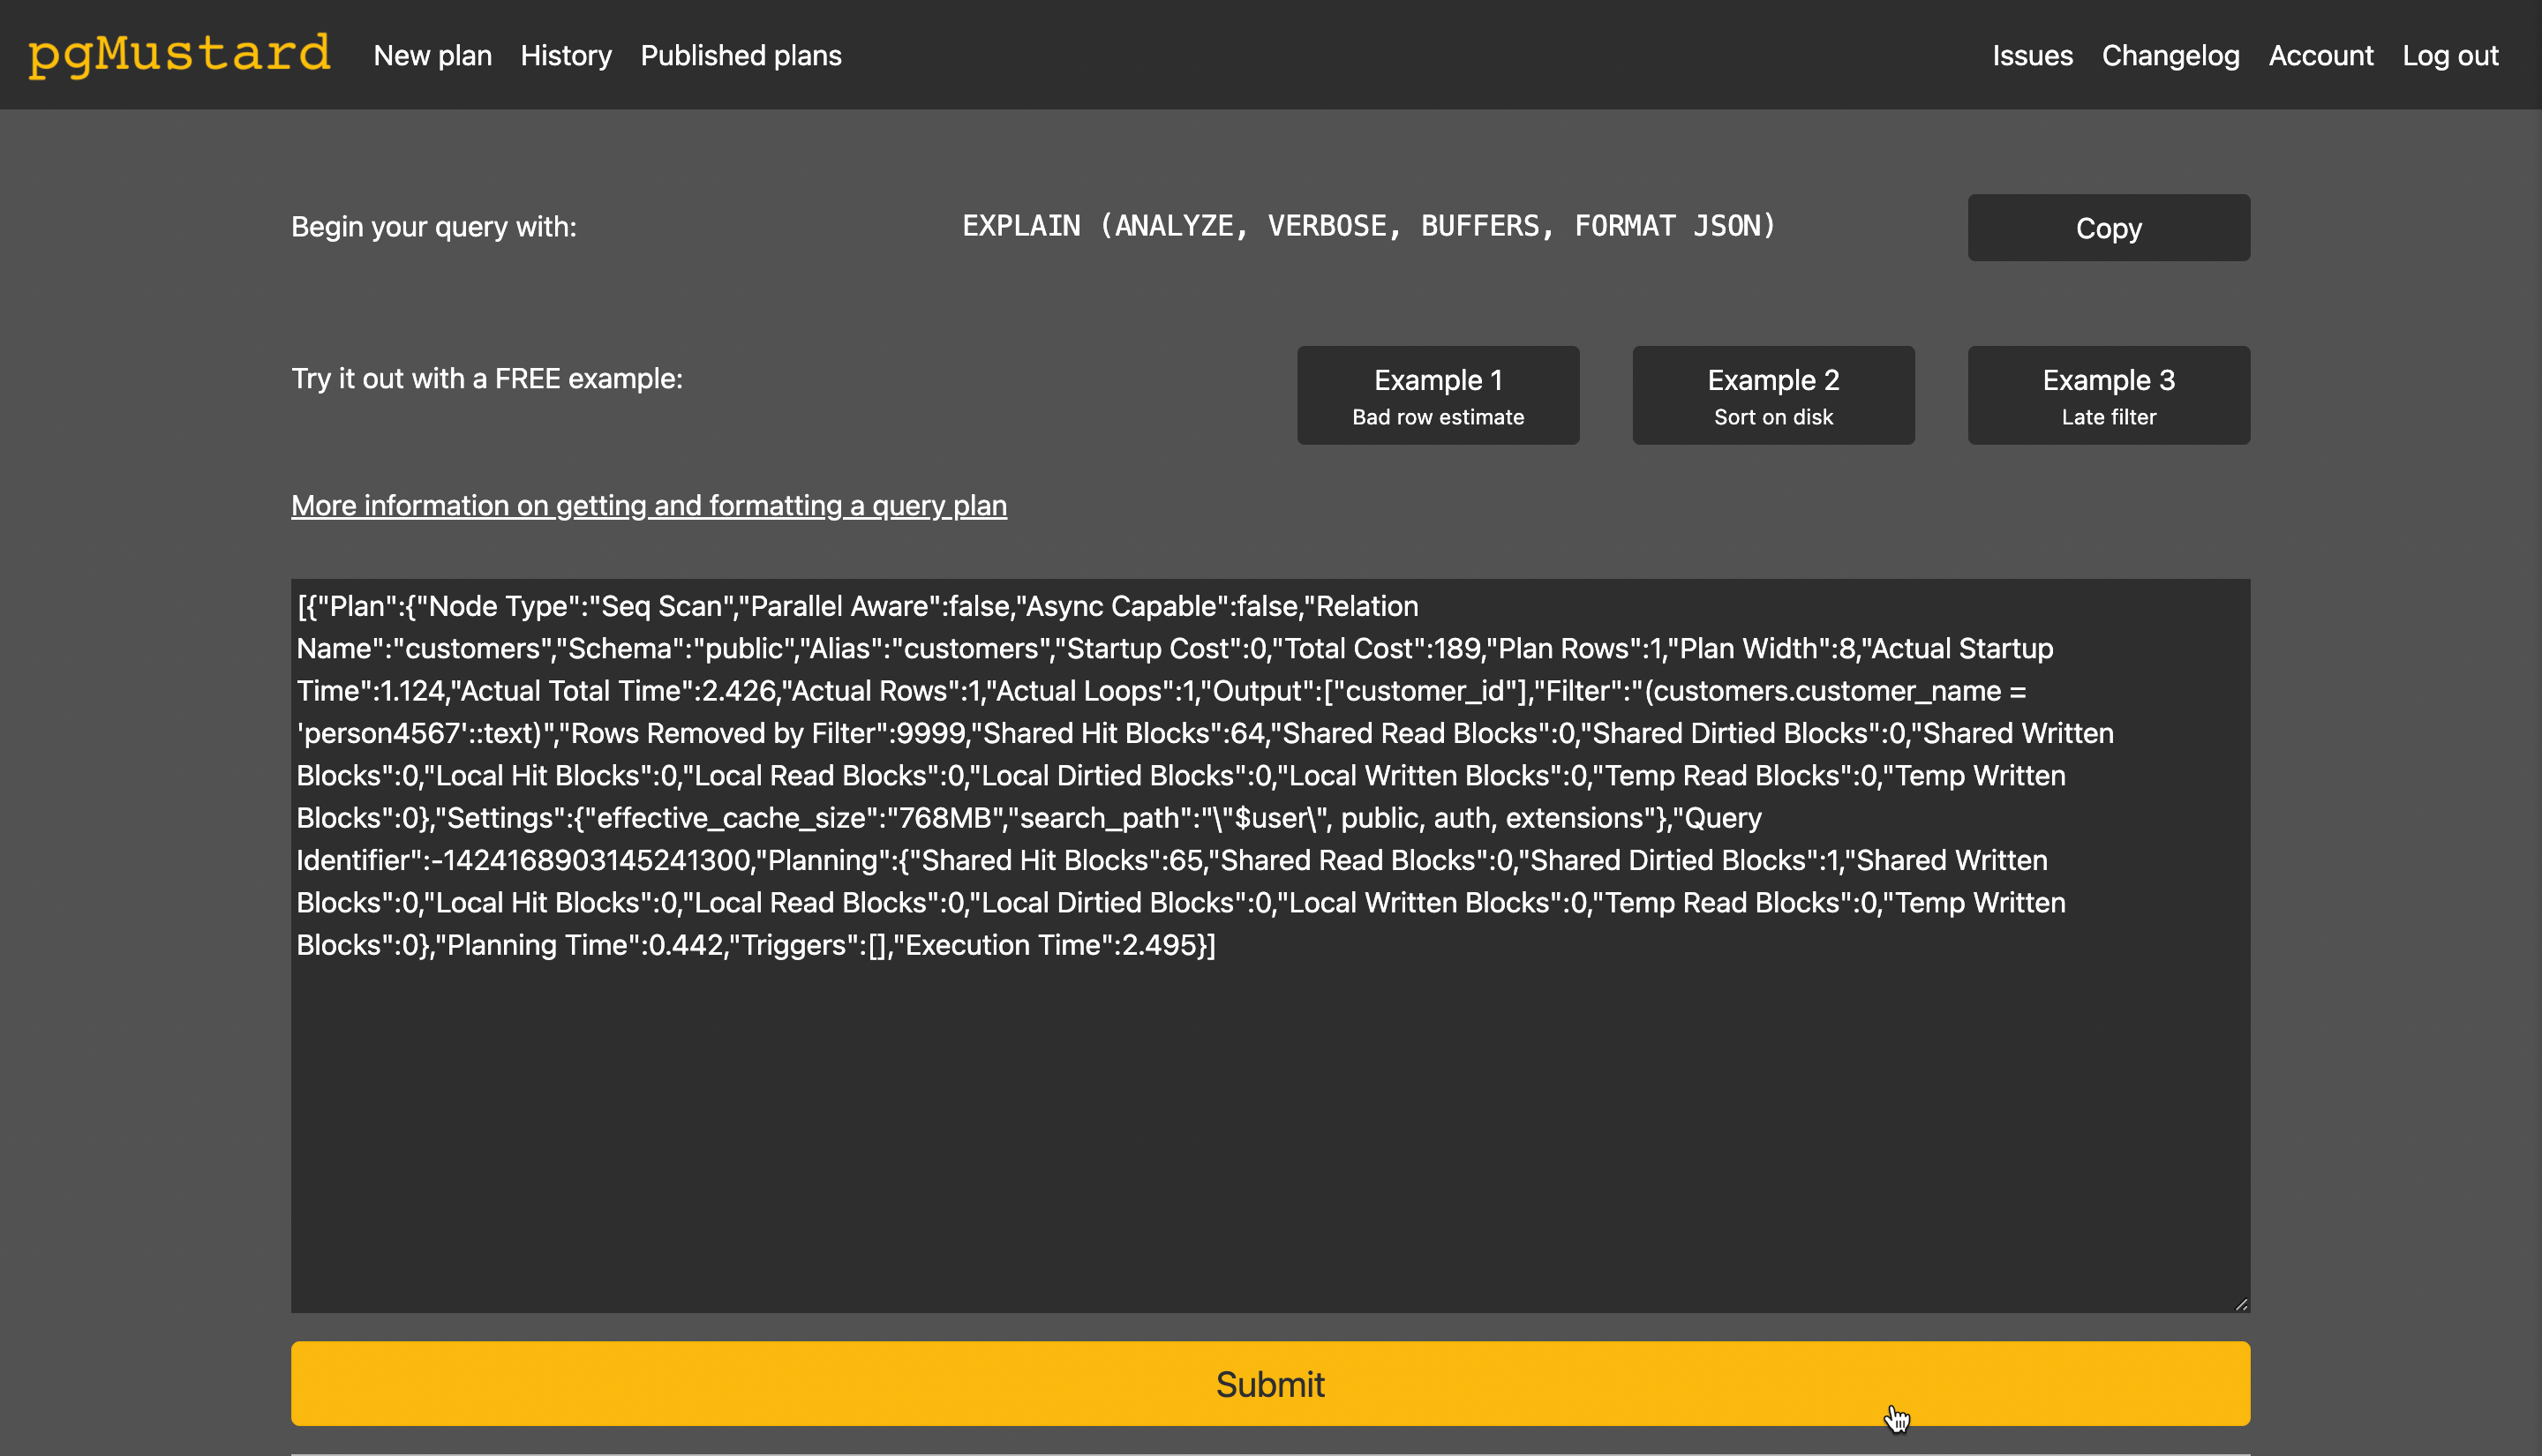
Paste the json output into pgMustard and press Submit.
Step 3: Look through the top tips and slowest operations
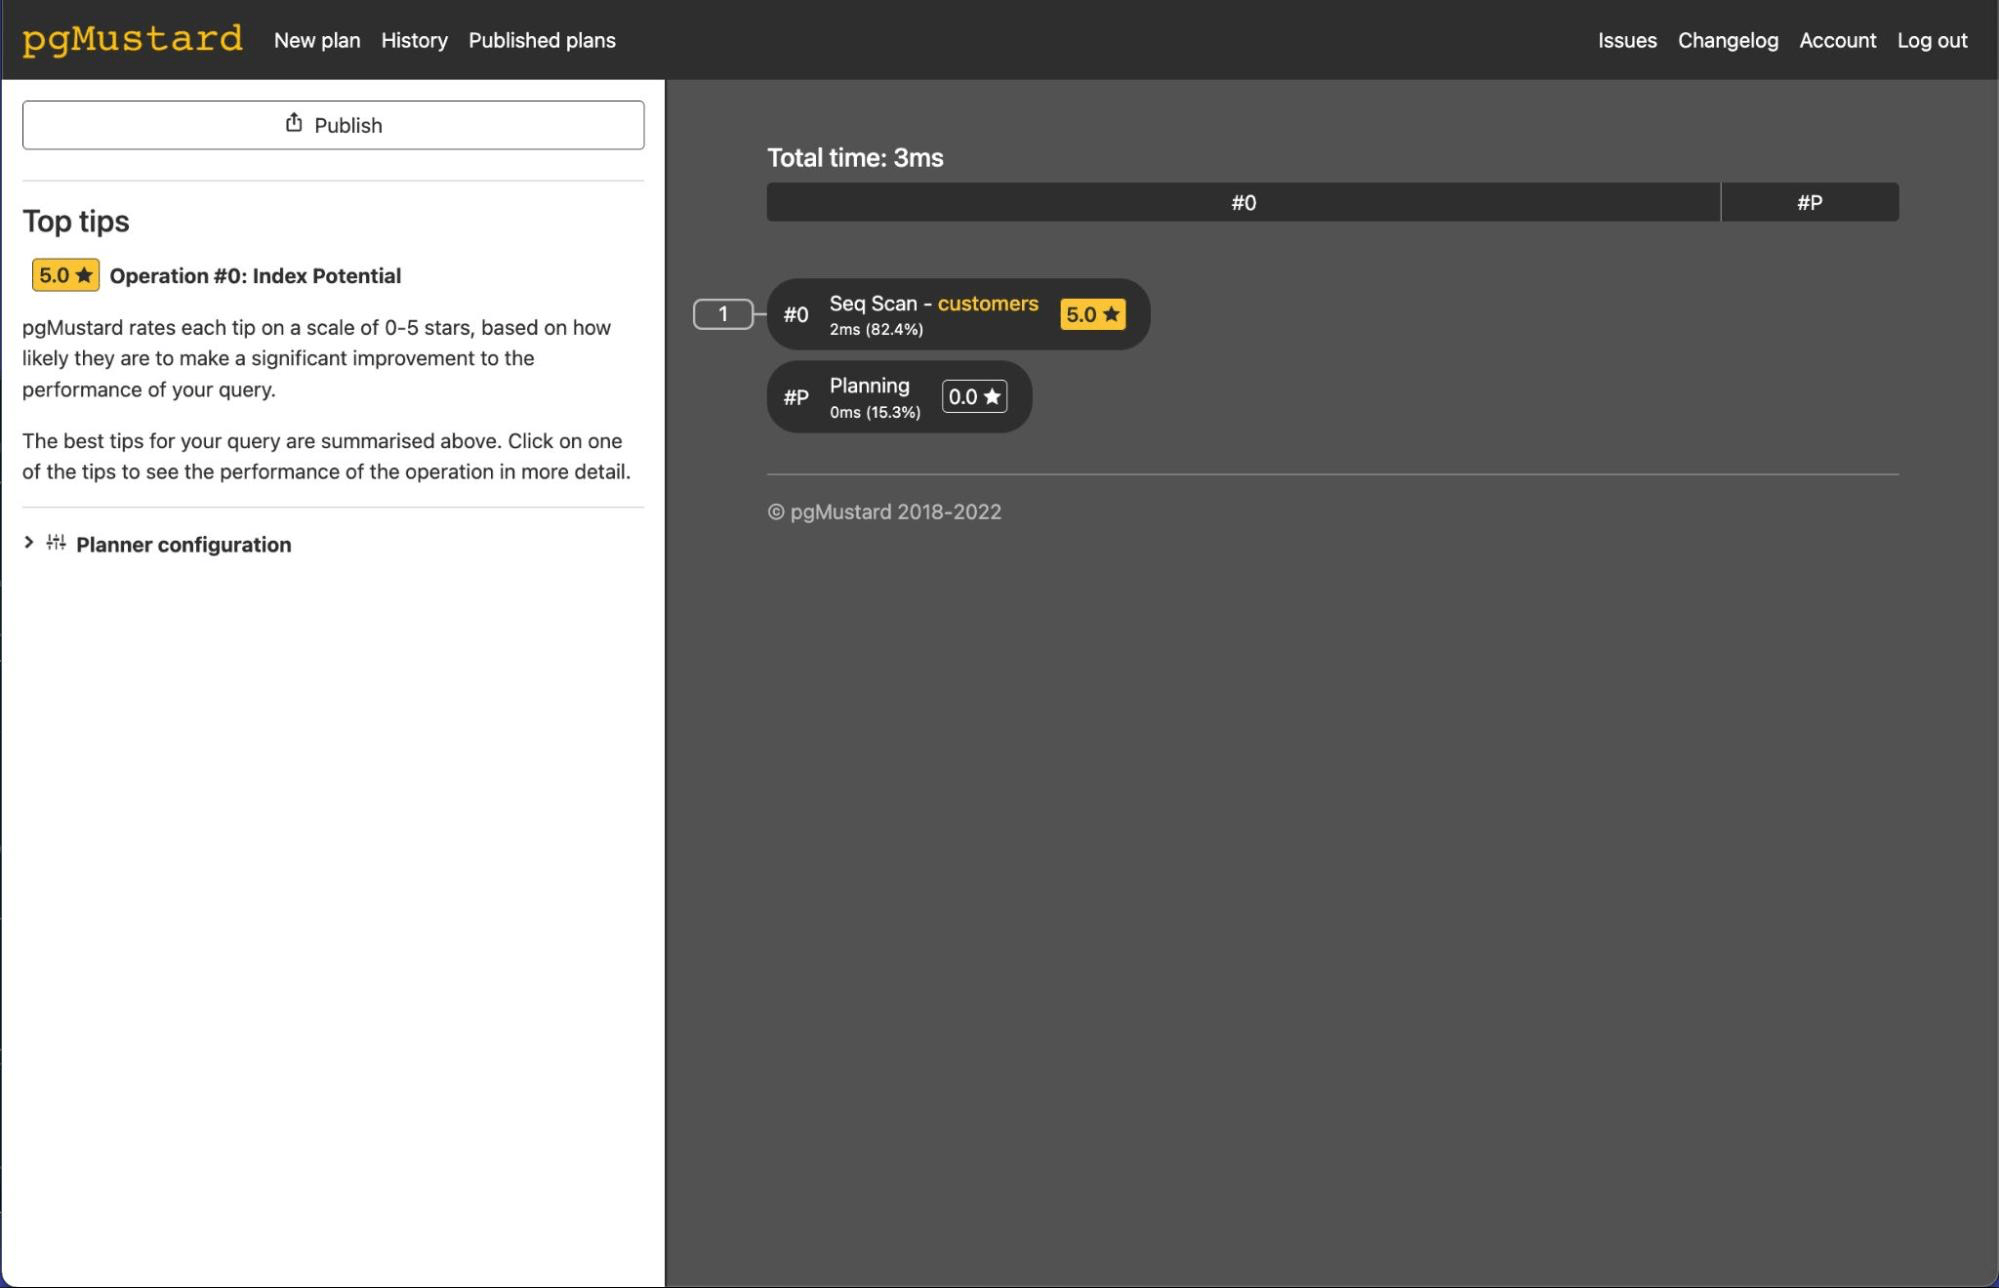
Review the top tips in pgMustard. These are scored on a scale of 0 to 5 stars, based on how much time-saving potential they have (5 stars meaning lots of potential).
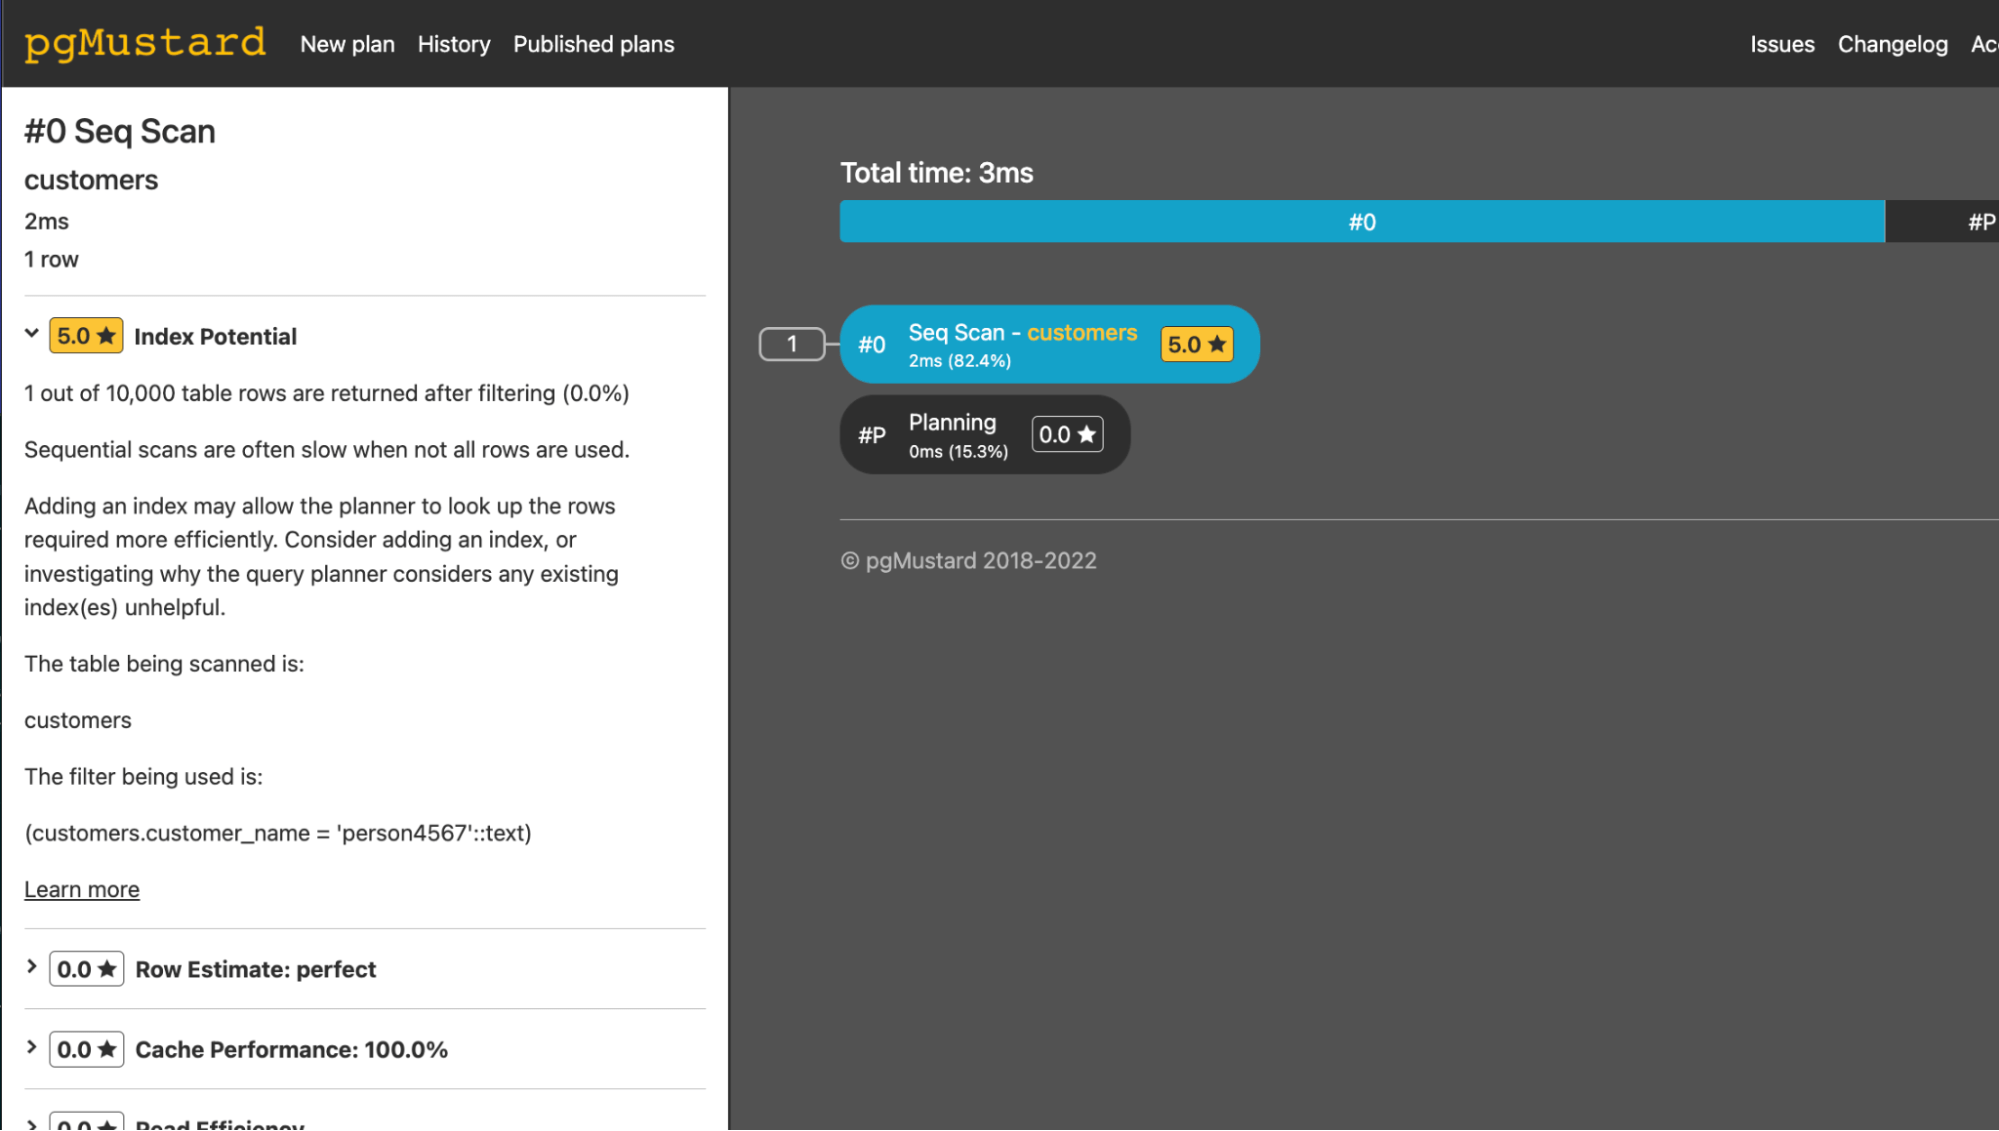
Click one of the tips, or one of the operations, to see more information.
Step 4: Consider your options
If you get some promising suggestions, you may wish to explore them.
If you don’t get any tips, your query might be quite fast for the amount of work it’s doing.
For the example we saw in Step 3, let's try adding an index on the customer_name field in Supabase.
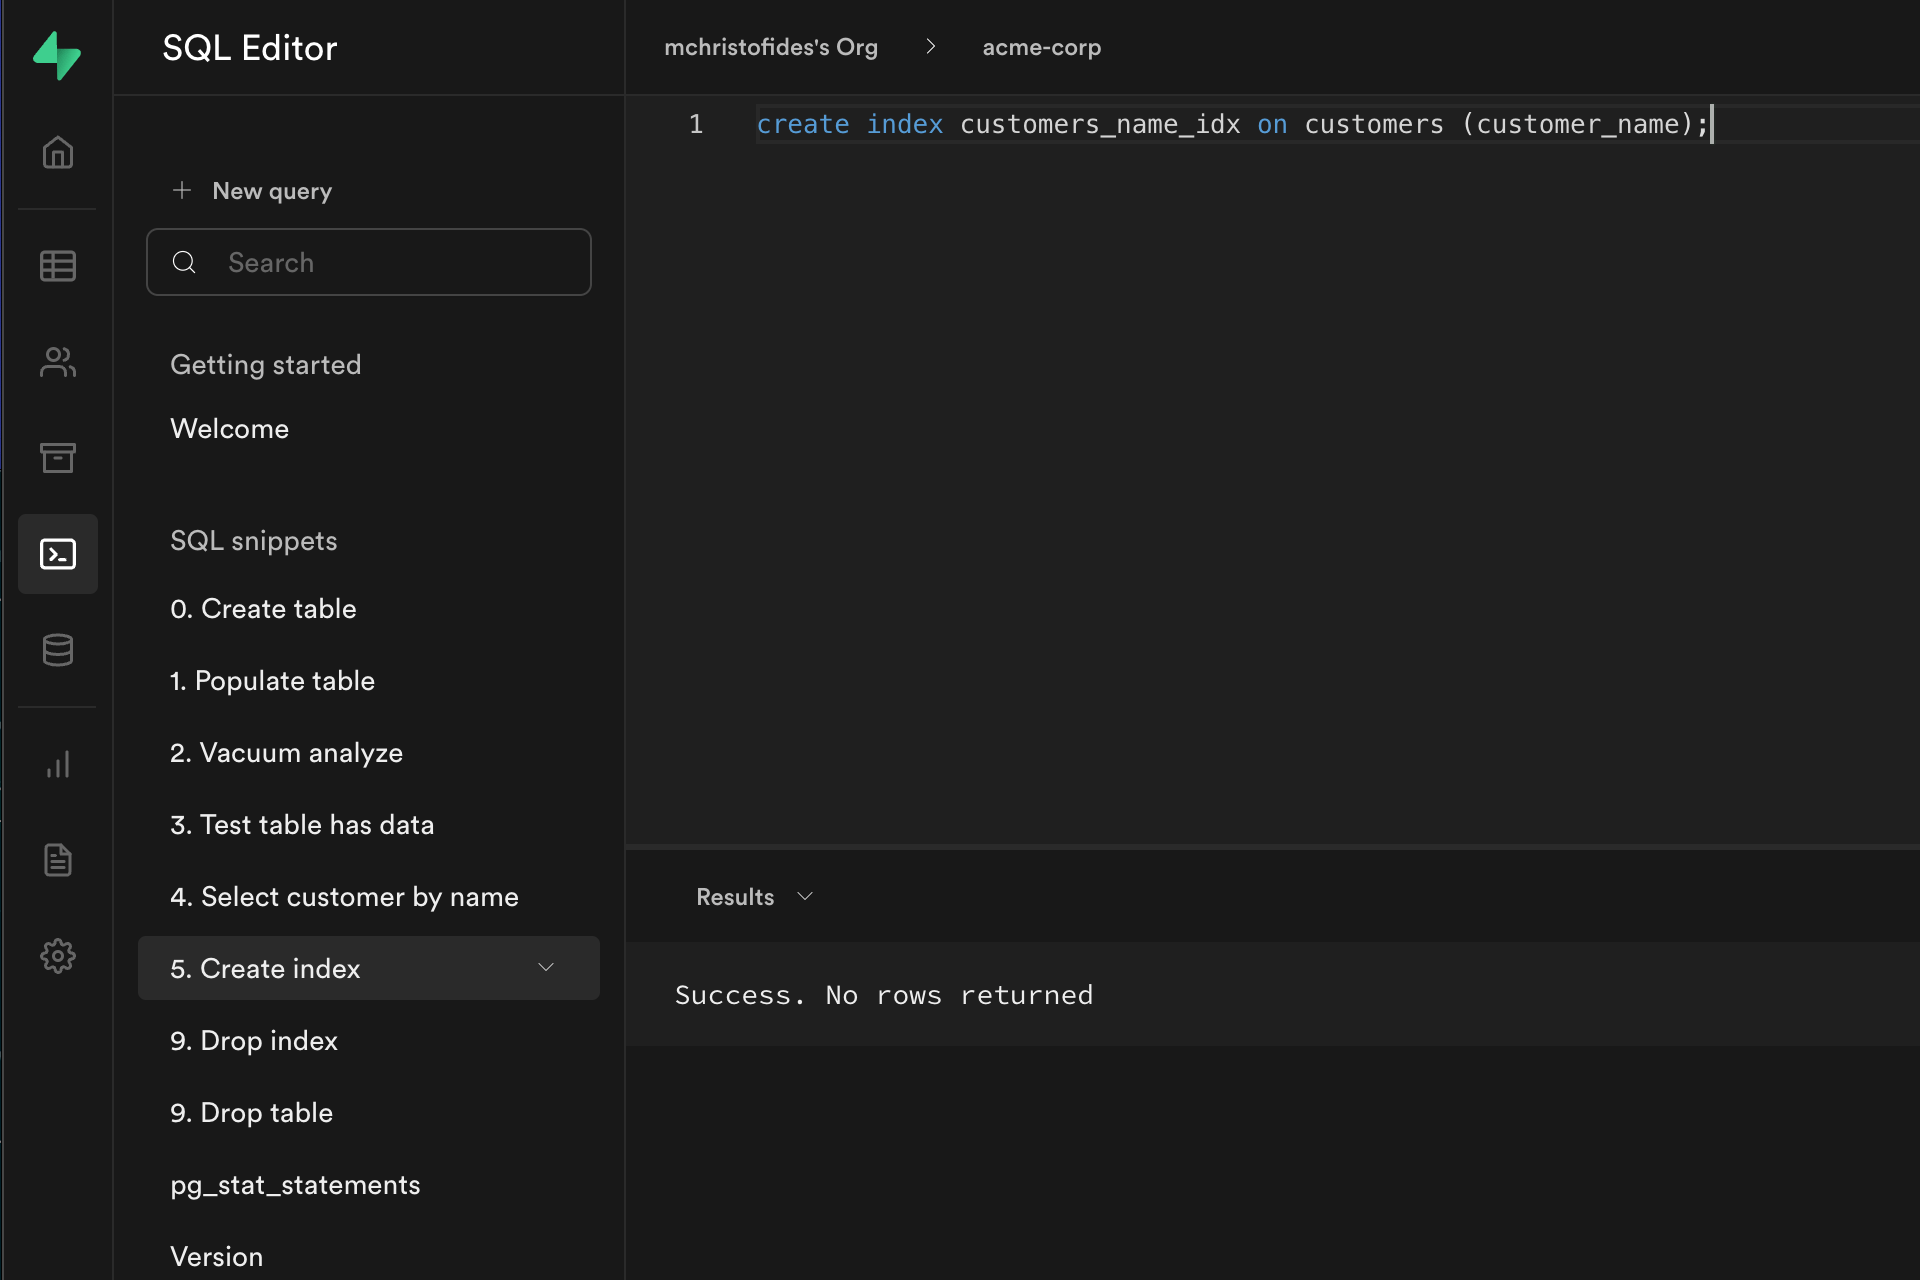
Going through Steps 1-3 again, we now get an efficient index scan, that will scale nicely as our data grows.
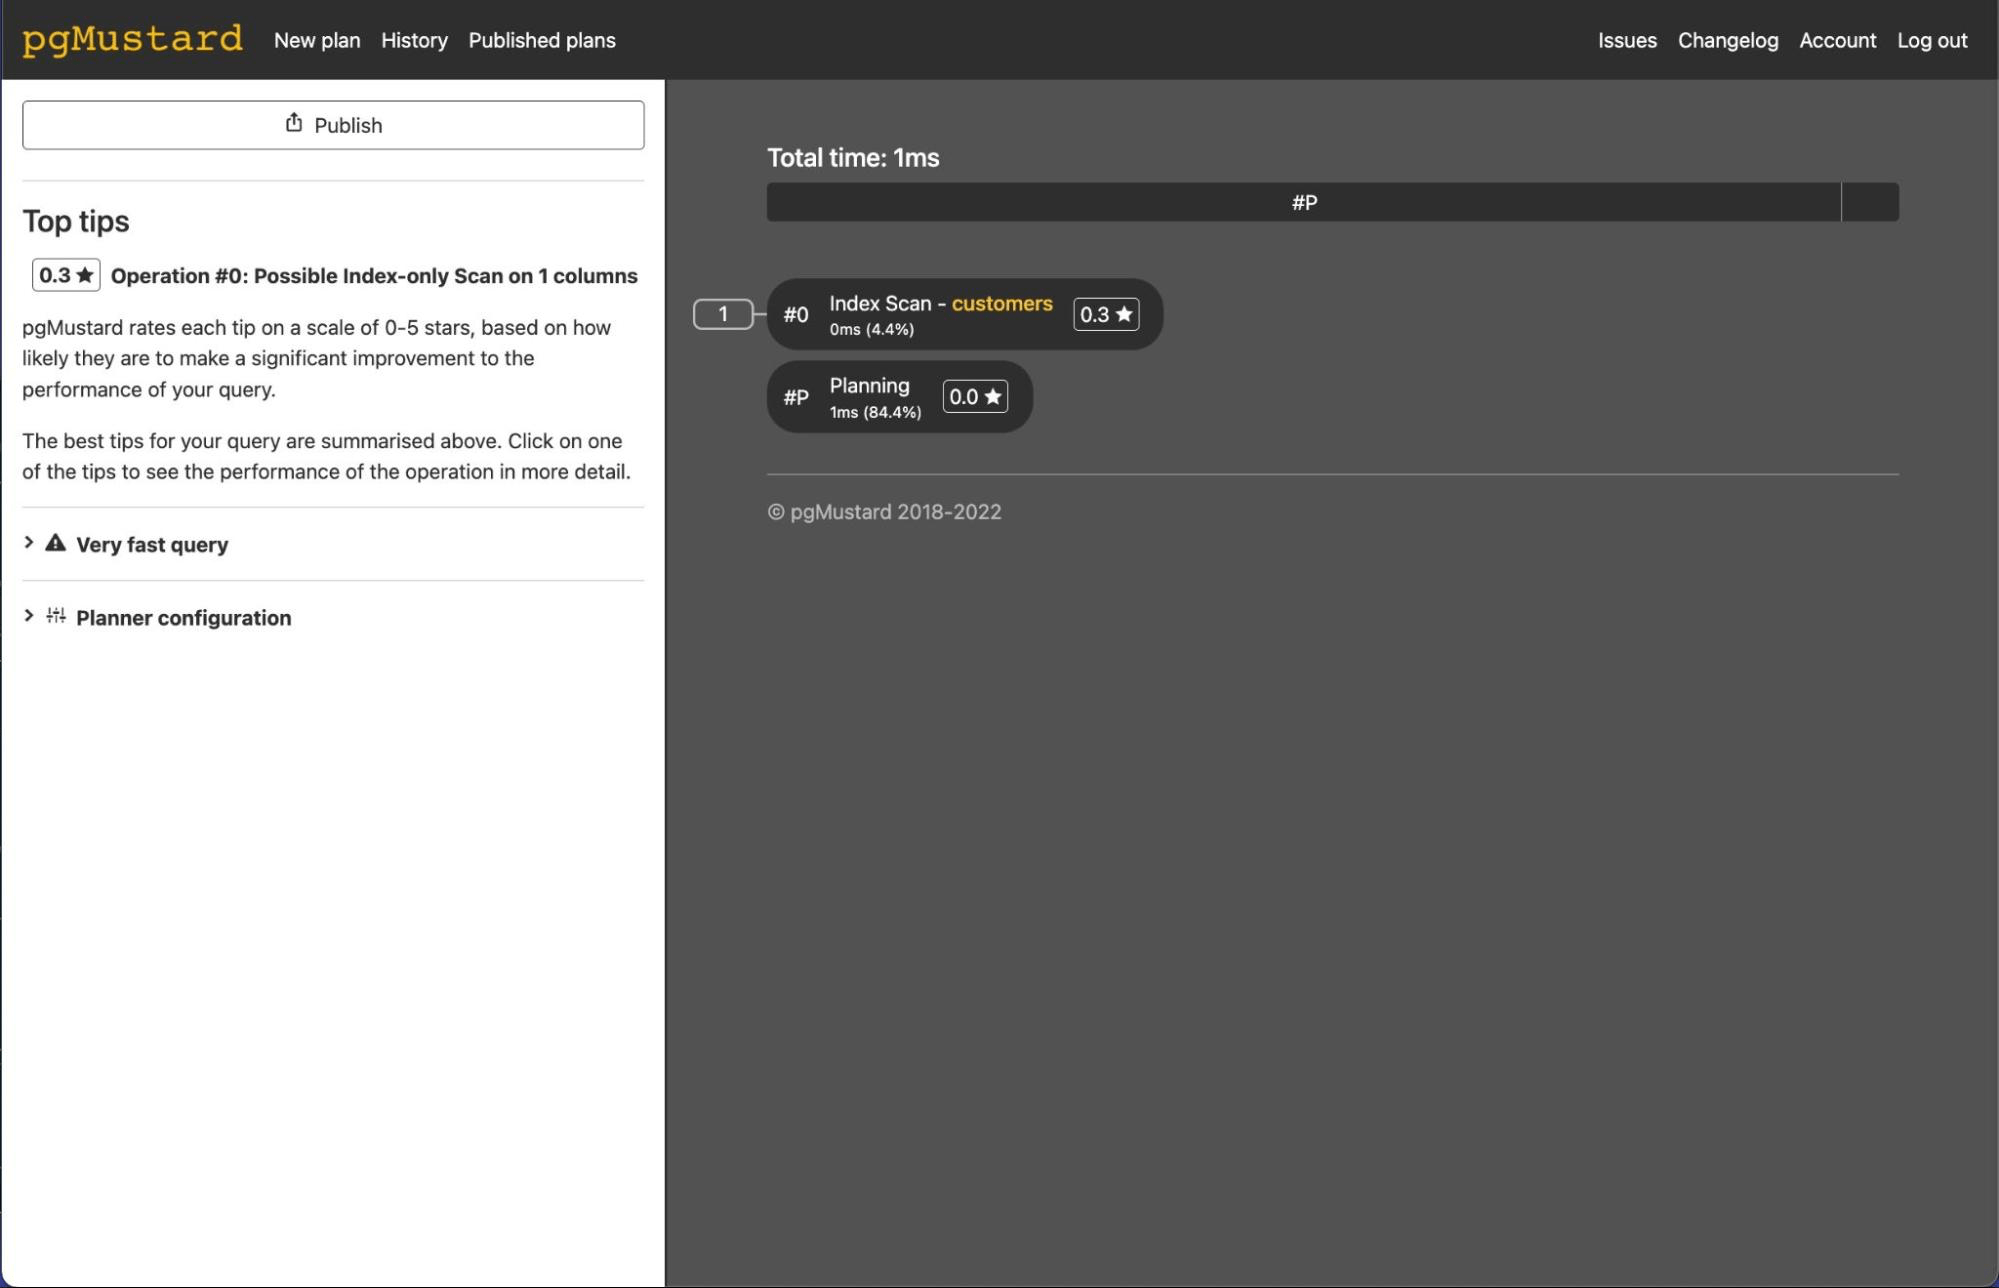
We could look into why Postgres isn’t choosing to do an index-only scan here, but pgMustard is letting us know that it doesn’t think we’ll gain much by doing so, by scoring the tip 0.3 out of 5.
Resources
- pgMustard official website.
- pgMustard explain glossary.